
R Markdown Quick Tutorial (Part II)
In the previous post, I have demonstrated five simple steps to construct your own R Markdown document. In this post, I am going to share some useful tips for adding mathematical expressions, inline graphs or tables to represent your results with clarity.
1. Inline Code
To add explanations to our R Markdown, we sometimes need to refer to the objects we created in the R Studio environment. Therefore, just simply insert its name with ` `` `. The results will appear as text without code.
For example,
According to the Table.1, the overall five-year survival rate for colon cancer patients is ` colon_five_year `
Results:
According to the Table.1, the overall five-year survival rate for colon cancer patients is 0.63
2. Mathematical expressions
Typing mathematical expressions in R markdown is the same in LATEX. The following table lists some frequently used symbols or mathematical operators.
| Input | Output | Input | Output |
|---|---|---|---|
| \langle | \rangle | ||
| \lbrace | \rbrace | ||
| \sum | \lim | ||
| \alpha | \beta | ||
| \gamma | \delta | ||
| \lambda | \mu |
For complete lists of mathematical expressions in LATEX format, Please visit the The Comprehensive LaTeX Symbol List.
Moreover, there are two writing modes for mathematical expressions in R markdown: the inline mode and the display mode. The first one is to add formulas that exist as a part of the text. The second one is to write expressions that are put on separate independent lines.
- Let’s see an example of the inline mode:
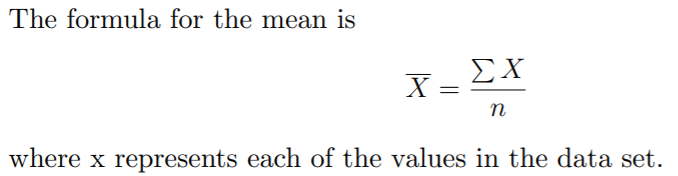
The formula for the mean is $ \overline{X} = \frac{\sum{X}}{n} $ where x represents each of the values in the data set.
Result:

- The example of displayed mode:
The formula for the mean is \(\overline{X} = \frac{\sum{X}}{n}\) where x represents each of the values in the data set.
Result:
3. Graphs
We have mentioned a lot of useful syntax in Markdown in my first post. The syntax is nearly the same in creating images in R Markdown & Markdown
For example:
Result:

4. Table
We use |, -, and enter to create table with Markdown.
- The first row has to be the “header row”, which determines the number of columns in this table.
- The second row must contain
-separating pipes|. - The pipes
|separate each column.
For example:
| header 1 | header 2 |
|---|---|
|row 1 col 1 | row 1 col 2|
|row 2 col 1 | row 2 col 2|
Result:
| header 1 | header 2 |
|---|---|
| row 1 col 1 | row 1 col 2 |
| row 2 col 1 | row 2 col 2 |
Reference
Written in January 2nd, 2021